Logging Performance
This document describes the behaviour of logging in Security servers (SecurityAPI, Authentication and Authorization) and its impact on performance.
Logging Component
The Sequel.Core.Logging.Seriloger implementation of the Sequel.Core.Logging.ILogger interface is used in Security. Seriloger doesn't writes traces immediately into the database. Writings are executed in these cases:
- Each 5 seconds.
- On dispose method. If logger is destroyed before reach 5 seconds from the last write then a flush is executed inside Dispose() method.
Before write in database, Seriloger can store an amount of logging traces only limited by system memory. All those traces are sent to database split in packets of 50 traces an inserted in database using 'insert bulk' operations.
Logging use in Security
Settings of Sequel.Core.Logging.Seriloger are stored in logging section of appsettings.json, and the values used by default in POTOROO and KANGAROO environments are:
appsettings.json "LoggingSettings": { "ConnectionString": "Server=SERVERNAME;Database=DATABASENAME;Trusted_Connection=True;MultipleActiveResultSets=true", "IgnoredLogTypes": [], "MinimumLogLevel": "Debug", "LoggingEnabled": "true" },
Each server Authorization, Authentication and SecurityAPI creates:
- A singleton instance of ILogger for registering application lifetime events (ApplicationStart, Application Stopping, ApplicationStopped)
- An instance for each request with a scoped lifetime.
Additionally Authorization server:
- A singleton instance ILogger for request's cache.
- A singleton instance for Message Bus consumers.
Logging Sequence for Authorization server endpoints
Authorization server has two GET endpoints HasPermissions y EffectivePermissions with same logging flow. We've considered only happy path scenario. There are two possible execution paths for each request depending on if request is cached or not:
1. Cache contains response
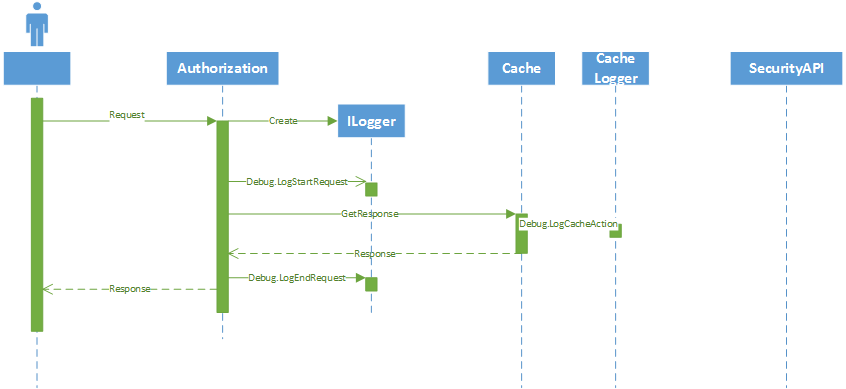
- Debug: 3 log traces per request.
- Information: 0 log traces per request.
2. Cache not contains response
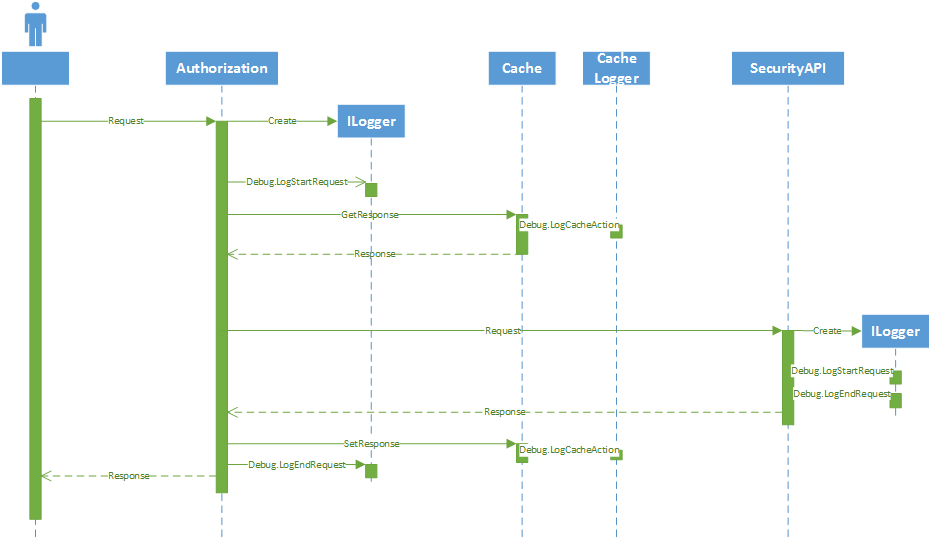
- Debug: 6 log traces per request.
- Information: 0 log traces per request.
Load Tests Setup
We use the same configuration for testing the Authorization server endpoints:
- 30 minutes running.
- Step goal of 100 users.
- Initial users are 10, adding 5 users each 10 seconds.
- Using Kangaroo environment.
- Data used: 2 applications, 5 groups, 5 users, 13 securables.
Results (Debug)
HasPermissions (Debug)
| Results | |
|---|---|
| Max User Load | 100 |
| Tests/Sec | 556 |
| Tests Failed | 0 |
| Avg. Test Time (sec) | 0.15 |
| Transactions/Sec | 0 |
| Avg. Transaction Time (sec) | 0 |
| Pages/Sec | 556 |
| Avg. Page Time (sec) | 0.15 |
| Requests/Sec | 556 |
| Requests Failed | 0 |
| Requests Cached Percentage | 0 |
| Avg. Response Time (sec) | 0.15 |
| Avg. Content Length (bytes) | 4.69 |
| Total Tests | 1,001,409 |
| Failed Tests (% of total) | 0 (0%) |
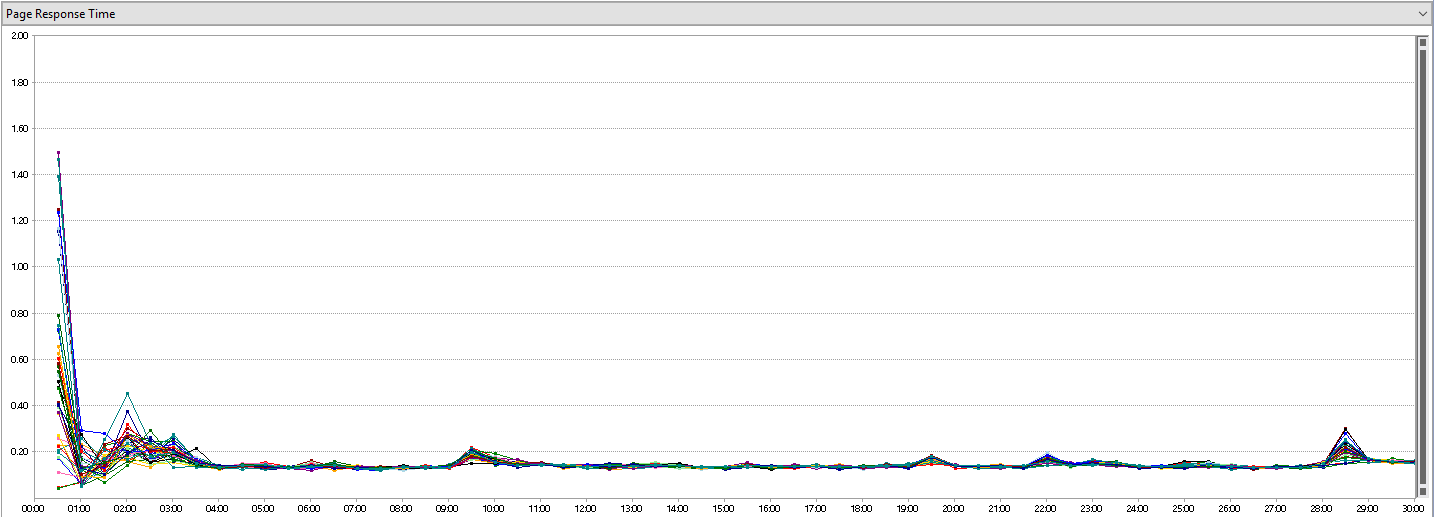
Great performance in Request/sec (556), Avg. Response Time(0.15s), Total Tests (≈1M) and Failed Test (0).
| Cache usage | ||
|---|---|---|
| Requests not in cache | 808 | 0.08% |
| Requests in cache | 1,000,601 | 99.92% |
| Total request | 1,001,409 | 100% |
Most of request are cached reducing in a great way the page response time.
| Generated logging traces | ||
|---|---|---|
| Action logs | 2,004,434 | 66.66% |
| Cache Action logs | 1,002,217 | 33.33% |
| Total logs | 3,006,651 | 100% |
Most of request are cache hence each request write 3 logging traces as are describe in previous section
| Sentence | Times | Total Execution Time(s) | Average Execution Time(s) |
|---|---|---|---|
| insert bulk | 1,050,472 | 11,556.447 | 0.011 |
Numbers according with number of request and cache interactions.
| Top slowest sentences | Execution Time(s) |
|---|---|
| insert bulk | 4.746 |
| insert bulk | 3.925 |
| insert bulk | 2.989 |
| insert bulk | 2.792 |
| insert bulk | 1.996 |
This slowest sentences could correspond to cache logger writings when concurrent users are 100. At this point there are 556+ (CacheActionLogs/request*Request/sec*5s)=(3*556*5)/50≈167 concurrent insert bulk.
EffectivePermissions (Debug)
| Results | |
|---|---|
| Max User Load | 100 |
| Tests/Sec | 3.31 |
| Tests Failed | 0 |
| Avg. Test Time (sec) | 18.4 |
| Transactions/Sec | 0 |
| Avg. Transaction Time (sec) | 0 |
| Pages/Sec | 3.31 |
| Avg. Page Time (sec) | 18.4 |
| Requests/Sec | 2.88 |
| Requests Failed | 0 |
| Requests Cached Percentage | 0 |
| Avg. Response Time (sec) | 18.4 |
| Avg. Content Length (bytes) | 370 |
| Total Tests | 5,958 |
| Failed Tests (% of total) | 0 (0) |
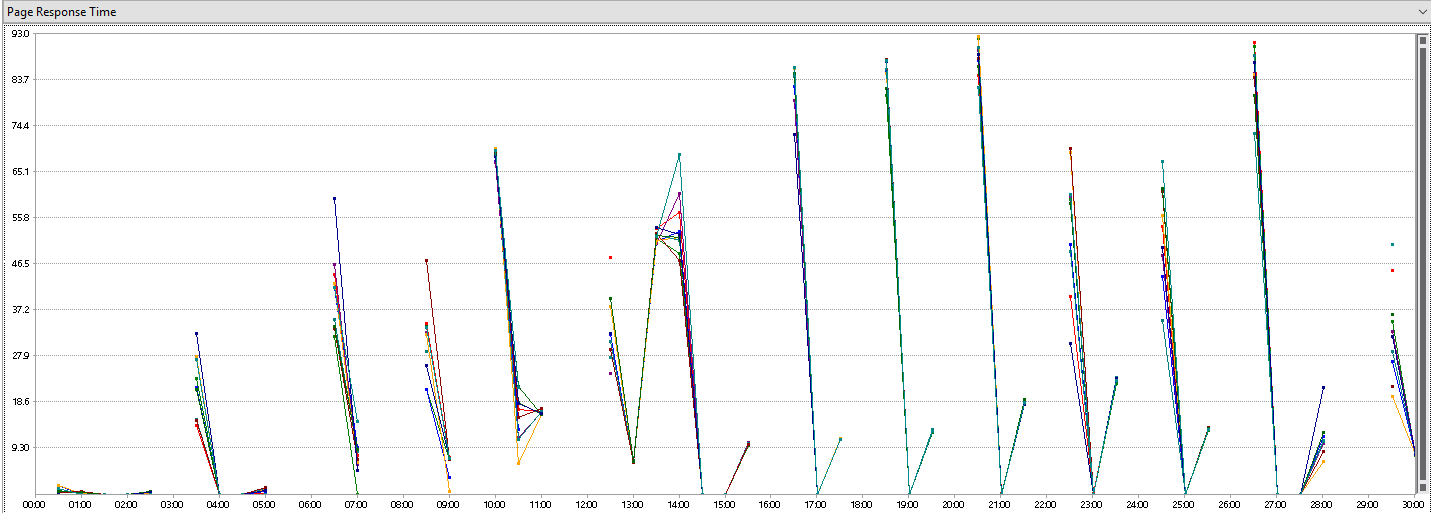
Low performance in Request/sec (2.88), Avg. Response Time(22.8s), Total Tests (≈5K).
| Cache usage | ||
|---|---|---|
| Requests not in cache | 39 | 0.65% |
| Requests in cache | 5,919 | 99.35% |
| Total request | 5,958 | 100% |
High cache usage reduces in a great way the execution of sql statements.
| Generated logging traces | ||
|---|---|---|
| Action logs | 12,120 | 66.44% |
| Cache Action logs | 6,099 | 33.44% |
| Total logs | 18,241 | 100% |
Numbers according with number of request and cache interactions.
| Sentence | Times | Total Execution Time(s) | Average Execution Time (s) |
|---|---|---|---|
| insert bulk | 7,759 | 46.311 | 0.006 |
Number slightly oversized according with number of request and cache interactions.
| Top slowest statements | Execution Time(s) |
|---|---|
| insert bulk | 16.996 |
| insert bulk | 10.011 |
| insert bulk | 0.499 |
| insert bulk | 0.073 |
| insert bulk | 0.066 |
Inexplicable results for the first two statements.
Commentaries
This results for EffectivePermissions are inexplicable because the execution path is pretty much similar to HasPermissions endpoint and it should be a slightly minor due to serialization of the response and response size. Many load test with empty logging database, different LoadTest database has been tried with no results.
Results (Information)
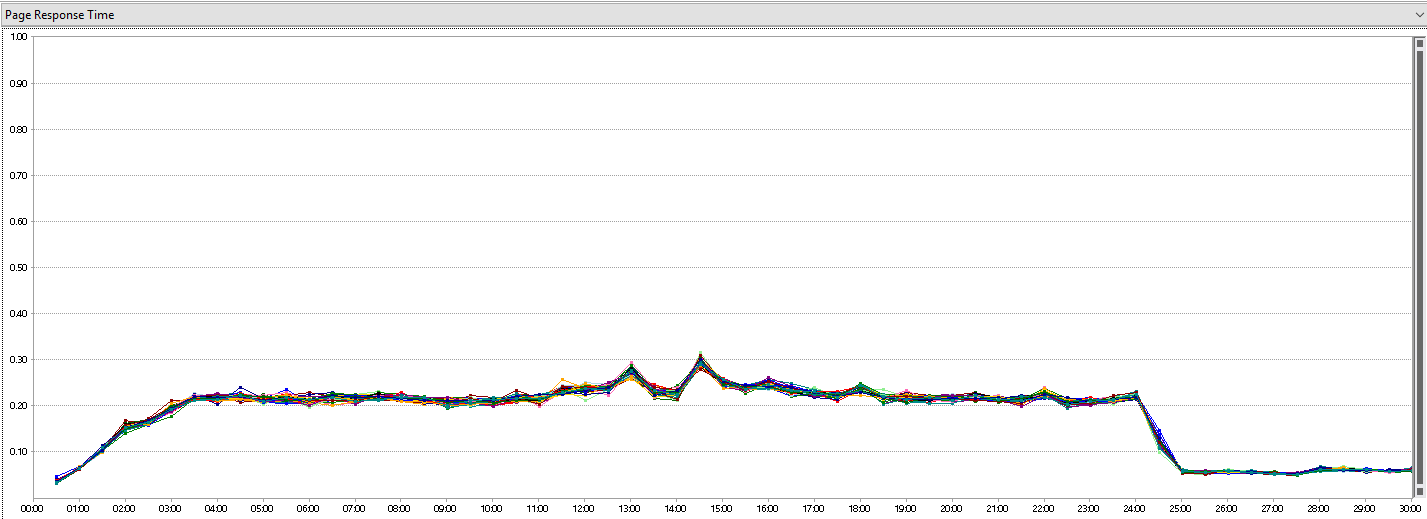
HasPermissions (Information)
| Results | |
|---|---|
| Max User Load | 100 |
| Tests/Sec | 448 |
| Tests Failed | 0 |
| Avg. Test Time (sec) | 0.17 |
| Transactions/Sec | 0 |
| Avg. Transaction Time (sec) | 0 |
| Pages/Sec | 468 |
| Avg. Page Time (sec) | 0.16 |
| Requests/Sec | 448 |
| Requests Failed | 0 |
| Requests Cached Percentage | 0 |
| Avg. Response Time (sec) | 0.15 |
| Avg. Content Length (bytes) | 4.71 |
| Total Tests | 843,249 |
| Failed Tests (% of total) | 0 (0%) |
Great performance in Request/sec (448), Avg. Response Time(0.16s), Total Tests (≈850K) and Failed Test (0).
| Cache usage | ||
|---|---|---|
| Requests not in cache | ≈1606 | 0.19% |
| Requests in cache | 841,643 | 99.81% |
| Total request | 843,249 | 100% |
Cache has no impact on logging.
| Generated logging traces | ||
|---|---|---|
| Action logs | 0 | 0% |
| Cache Action logs | 0 | 0% |
| Total logs | 0 | 0% |
No Information logging traces.
| Sentence | Times | Total Execution Time(s) | Average Execution Time (s) |
|---|---|---|---|
| insert bulk | 0 | 0 | 0 |
No insert bulk operations
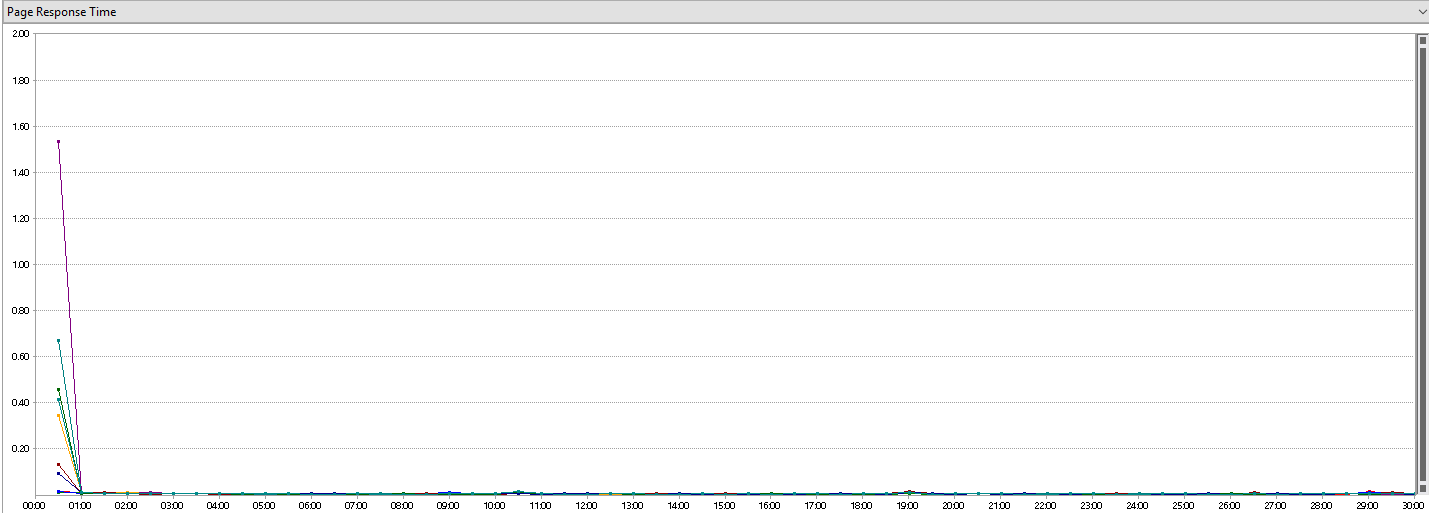
EffectivePermissions (Information)
| Results | |
|---|---|
| Max User Load | 100 |
| Tests/Sec | 9.53 |
| Tests Failed | 0 |
| Avg. Test Time (sec) | 0.012 |
| Transactions/Sec | 0 |
| Avg. Transaction Time (sec) | 0 |
| Pages/Sec | 9.53 |
| Avg. Page Time (sec) | 0.01 |
| Requests/Sec | 9.53 |
| Requests Failed | 0 |
| Requests Cached Percentage | 0 |
| Avg. Response Time (sec) | 0.01 |
| Avg. Content Length (bytes) | 370 |
| Total Tests | 17,154 |
| Failed Tests (% of total) | 0 (0) |
Moderate performance in Request/sec (9.53) and Total Tests (≈17K). Great performance in Avg. Response Time(0.01s).
| Cache usage | ||
|---|---|---|
| Requests not in cache | ≈72 | ≈0.41% |
| Requests in cache | 17,082 | 99.58% |
| Total request | 17,154 | 100% |
Cache has no impact on logging.
| Generated logging traces | ||
|---|---|---|
| Action logs | 0 | 0% |
| Cache Action logs | 0 | 0% |
| Total logs | 0 | 0% |
No Information logging traces.
| Sentence | Times | Total Execution Time(s) | Average Execution Time (s) |
|---|---|---|---|
| insert bulk | 0 | 0 | 0 |
No insert bulk operations
Commentaries
This results for EffectivePermissions are quite better that Debug inexplicable because the execution path is pretty much similar to HasPermissions endpoint and it should be a slightly minor due to serialization of the response and response size.
Improvements
- Include CacheAction in IgnoredLogTypes property in logging configuration section would reduce logging traces about a 33% and insert bulk operations depending on endpoint performance (request/sec)5s/50)*.
- Include Action in IgnoredLogTypes property in logging configuration section would reduce logging traces about a 66% and insert bulk operations depending on the number for request per second.