Database Performance
This document describes the behaviour of Security servers (SecurityAPI, Authorization) related to database interactions and SQL statements executed.
Database
Security servers interact with these SQL databases:
- Authentication: Logging DB.
- Authorization: Logging DB.
- SecurityAPI: Multi-tenant DB, Tenant DB, Logging DB.
As we see, only SecurityAPI interacts with business databases through two data context: authentication context and authorization context. Logging databases could be different for each server but in this document all servers share the same logging DB.
SQL statements sequence for Authorization server endpoints
Authorization server has two GET endpoints HasPermissions y EffectivePermissions with same logging flow. We've considered only happy path scenario. There are two possible execution paths for each request depending on if request is cached or not:
1. Cache contains response
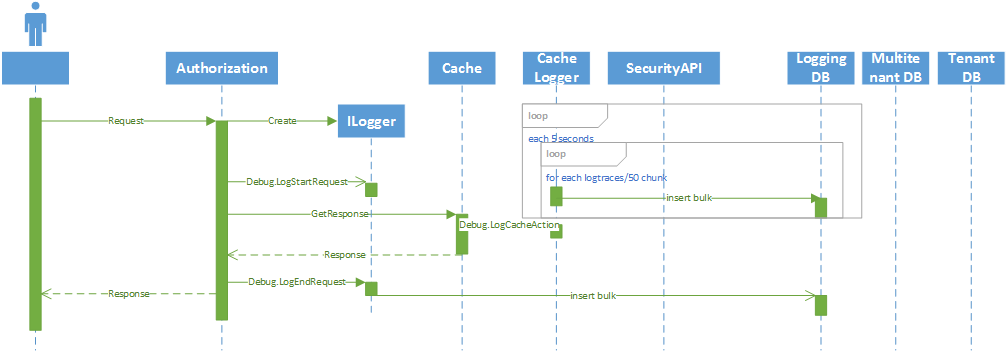
- Debug: 1 insert bulk per request. Each 5 seconds several insert bulk operations depending on the number of cache interactions.
- Information: 0 insert bulk per request.
2. Cache not contains response
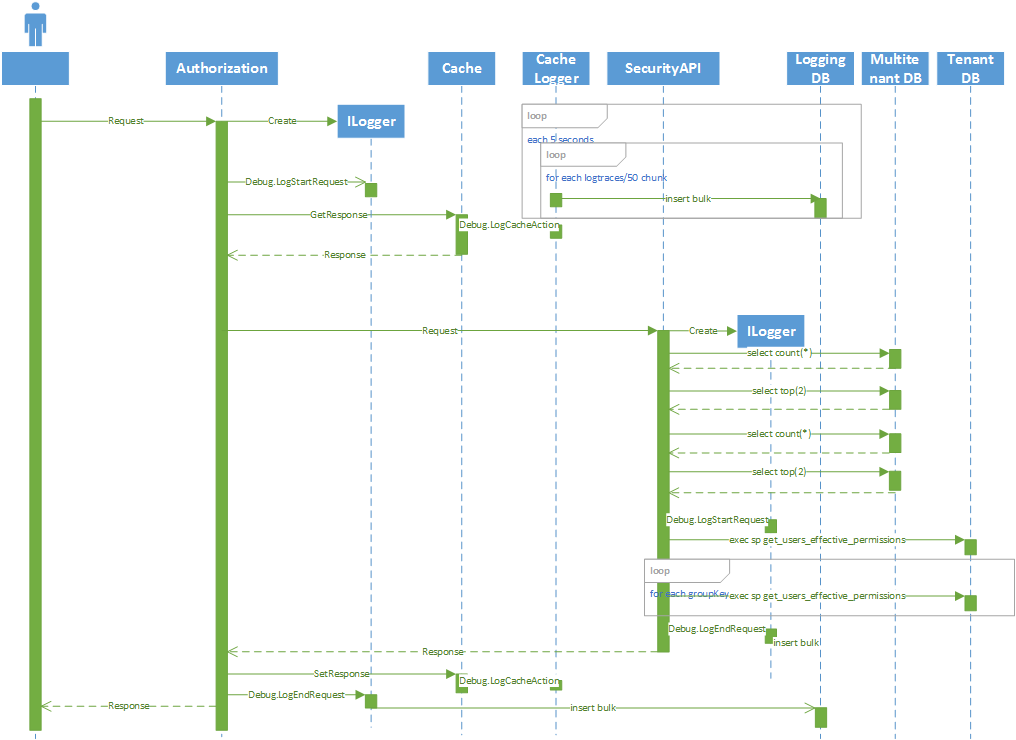
- Debug: 1 insert bulk per request and 4 queries required for database context creation and 1 to n executions of get_user_effective_permissions store procedure depending on number of groupKeys supplied as requests' parameter. Each 5 seconds several insert bulk operations depending on the number of cache interactions.
- Information: 0 insert bulk per request and 4 queries required for database context creation and 1 to n executions of get_user_effective_permissions store procedure depending on number of groupKeys supplied as requests' parameter.
Load Tests Setup
We used the same configuration for testing the Authorization server endpoints:
- 30 minutes running.
- Step goal of 100 users.
- Initial users are 10, adding 5 users each 10 seconds.
- Using Kangaroo environment.
- Data used: 2 applications, 5 groups, 5 users, 13 securables.
Results (Debug)
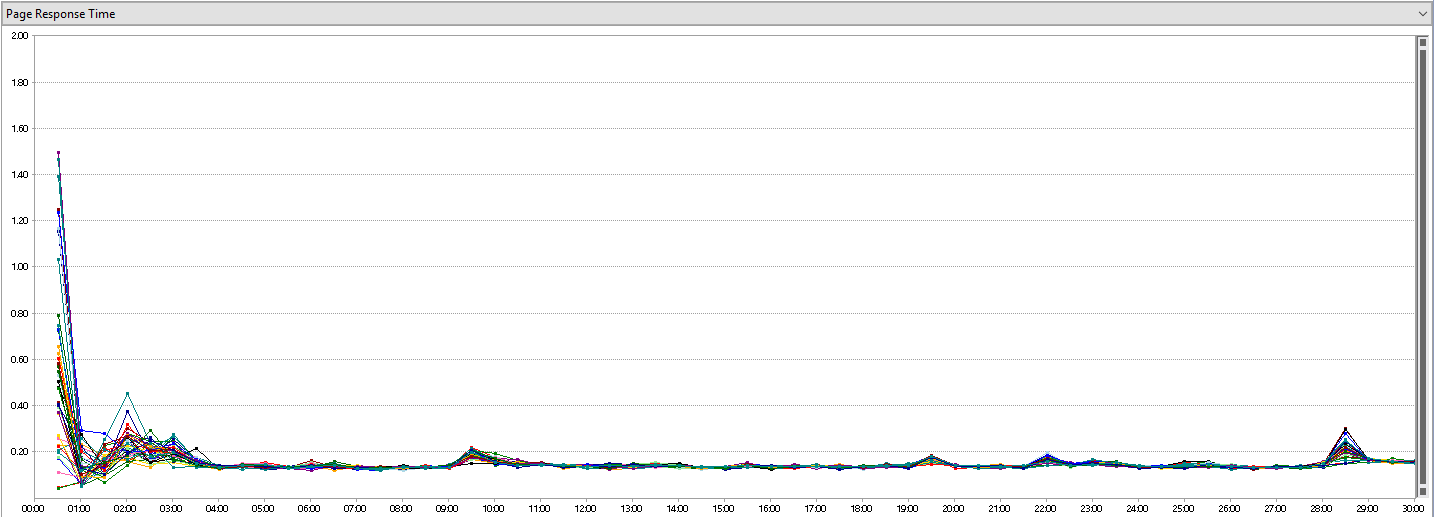
HasPermissions (Debug)
| Results | |
|---|---|
| Max User Load | 100 |
| Tests/Sec | 556 |
| Tests Failed | 0 |
| Avg. Test Time (sec) | 0.15 |
| Transactions/Sec | 0 |
| Avg. Transaction Time (sec) | 0 |
| Pages/Sec | 556 |
| Avg. Page Time (sec) | 0.15 |
| Requests/Sec | 556 |
| Requests Failed | 0 |
| Requests Cached Percentage | 0 |
| Avg. Response Time (sec) | 0.15 |
| Avg. Content Length (bytes) | 4.69 |
| Total Tests | 1,001,409 |
| Failed Tests (% of total) | 0 (0%) |
Great performance in Request/sec (556), Avg. Response Time(0.15), Total Tests (≈1M) and Failed Test (0).
| Cache usage | ||
|---|---|---|
| Requests not in cache | 808 | 0.08% |
| Requests in cache | 1,000,601 | 99.92% |
| Total request | 1,001,409 | 100% |
High cache usage reduces in a great way the execution of sql statements.
| SQL Statement | Times | Total Execution Time(s) | Average Execution Time (s) | |---------------------------------------------------------------------------------------------------------------------------| | insert bulk... | 1,050,472 | 11,556.447392 | 0.011001 | | SELECT COUNT(*)... | 1,616 | 0.053103 | 0.000033 | | SELECT TOP(2)... | 1,616 | 0.053103 | 0.000033 | | exec [Authorization].get_user_effective_permissions... | 96 | 0.033657 | 0.000351 | | exec [Authorization].get_user_effective_permissions... | 96 | 0.038144 | 0.000397 | | exec [Authorization].get_user_effective_permissions... | 96 | 0.027399 | 0.000260 | | exec [Authorization].get_user_effective_permissions... | 96 | 0.024993 | 0.000260 | | exec [Authorization].get_user_effective_permissions... | 96 | 0.029346 | 0.000306 | | exec [Authorization].get_user_effective_permissions... | 49 | 0.017426 | 0.000355 | | exec [Authorization].get_user_effective_permissions... | 49 | 0.013298 | 0.000271 |
SELECT operations are unnecessary repeated but them are executed fast (0.033 ms). Executions of SP are fast too, between 0.25 ms and 0.4ms. Insert bulk operations are clearly slowest with 11ms.
| Top slowest statements | Execution Time(s) |
|---|---|
| insert bulk | 4.746 |
| insert bulk | 3.925 |
| insert bulk | 2.989 |
| insert bulk | 2.792 |
| insert bulk | 1.996 |
This slowest statements could correspond to cache logger writings when concurrent users are 100. At this point there are 556+ (CacheActionLogs/request*Request/sec*5s)=(35565)/50≈167 concurrent insert bulk.
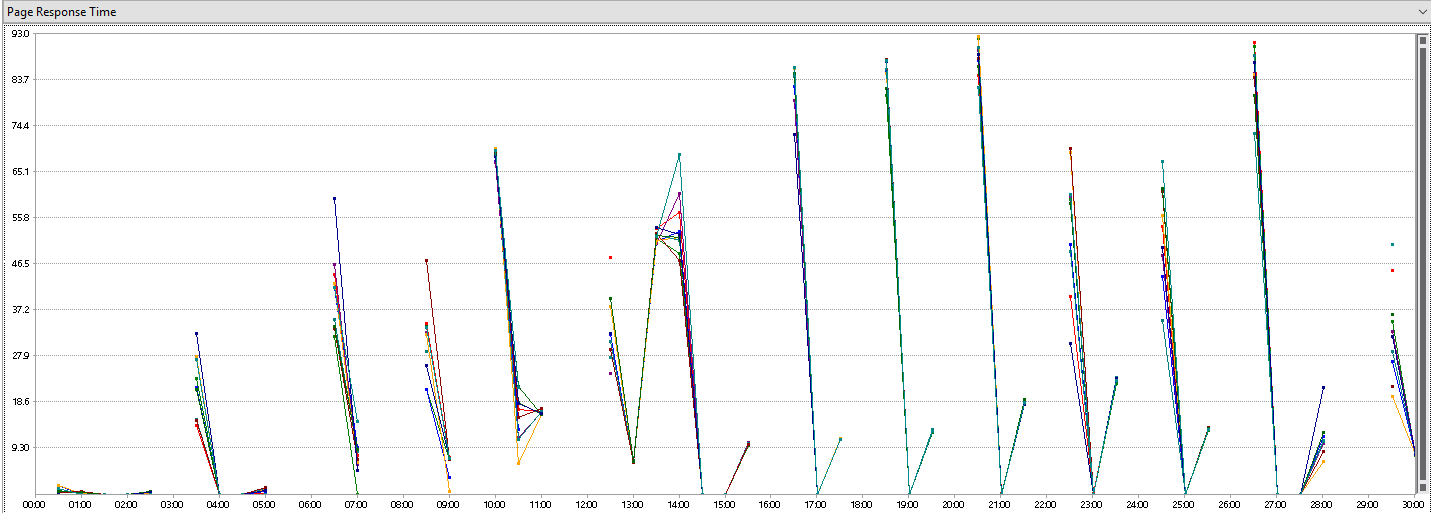
EffectivePermissions (Debug)
| Results | |
|---|---|
| Max User Load | 100 |
| Tests/Sec | 3.31 |
| Tests Failed | 0 |
| Avg. Test Time (sec) | 18.4 |
| Transactions/Sec | 0 |
| Avg. Transaction Time (sec) | 0 |
| Pages/Sec | 3.31 |
| Avg. Page Time (sec) | 18.4 |
| Requests/Sec | 2.88 |
| Requests Failed | 0 |
| Requests Cached Percentage | 0 |
| Avg. Response Time (sec) | 18.4 |
| Avg. Content Length (bytes) | 370 |
| Total Tests | 5,958 |
| Failed Tests (% of total) | 0 (0) |
Low performance in Request/sec (2.88), Avg. Response Time(22.8s), Total Tests (≈5K).
| Cache usage | ||
|---|---|---|
| Requests not in cache | 39 | 0.65% |
| Requests in cache | 5,919 | 99.35% |
| Total request | 5,958 | 100% |
High cache usage reduces in a great way the execution of sql statements.
| SQL Statement | Times | Total Execution Time(s) | Average Execution Time (s) | |---------------------------------------------------------------------------------------------------------------------------| | insert bulk... | 7,759 | 46.311679 | 0.005969 | | SELECT COUNT(*)... | 74 | 0.002629 | 0.000035 | | SELECT TOP(2)... | 74 | 0.002629 | 0.000035 | | exec [Authorization].get_user_effective_permissions... | 3 | 0.009615 | 0.003205 | | exec [Authorization].get_user_effective_permissions... | 3 | 0.000750 | 0.000250 | | exec [Authorization].get_user_effective_permissions... | 2 | 0.000731 | 0.000366 | | exec [Authorization].get_user_effective_permissions... | 2 | 0.028336 | 0.014168 | | exec [Authorization].get_user_effective_permissions... | 2 | 0.000455 | 0.000226 | | exec [Authorization].get_user_effective_permissions... | 2 | 0.000448 | 0.000224 | | exec [Authorization].get_user_effective_permissions... | 2 | 0.000627 | 0.000314 |
SELECT operations are unnecessary repeated but them are executed fast (0.033 ms). Executions of SP are fast mainly, between 0.25 ms and 0.36ms but are two operations quite slow, between 1.4ms and 3.2ms. Insert bulk operations are clearly slowest with 5.9ms.
| Top slowest statements | Execution Time(s) |
|---|---|
| insert bulk | 16.996 |
| insert bulk | 10.011 |
| insert bulk | 0.499 |
| insert bulk | 0.073 |
Inexplicable results for the first two statements.
Commentaries
This results for EffectivePermissions are inexplicable because the execution path is pretty much similar to HasPermissions endpoint and it should be a slightly minor due to serialization of the response and response size. Many load test with empty logging database, different LoadTest database has been tried with no results.
Results (Information)
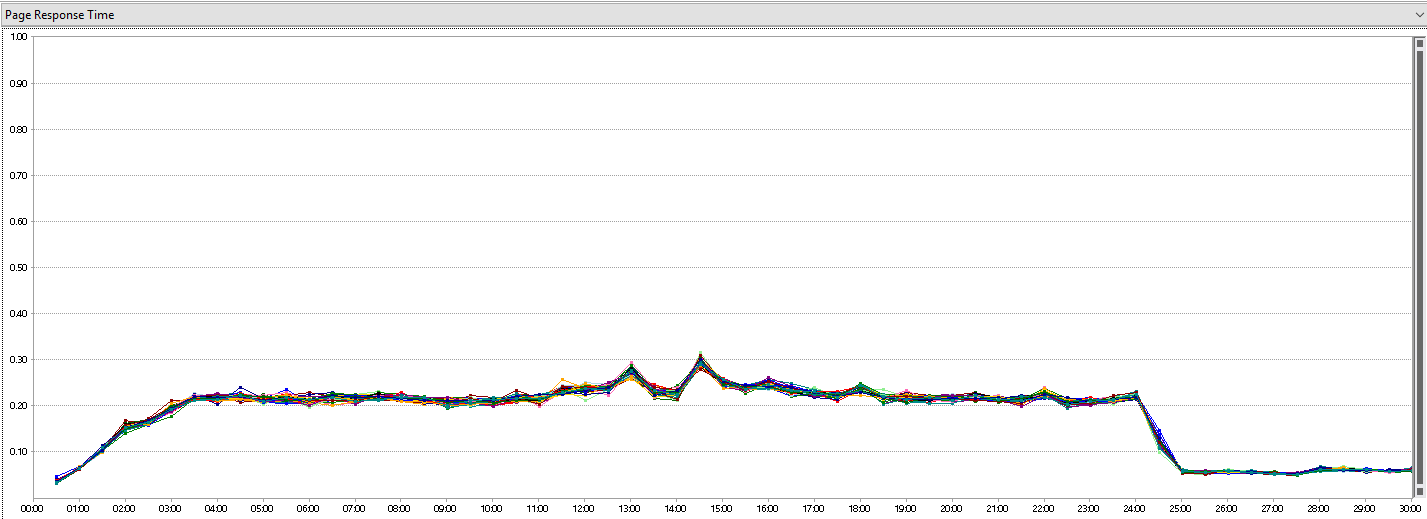
HasPermissions (Information)
| Results | |
|---|---|
| Max User Load | 100 |
| Tests/Sec | 448 |
| Tests Failed | 0 |
| Avg. Test Time (sec) | 0.17 |
| Transactions/Sec | 0 |
| Avg. Transaction Time (sec) | 0 |
| Pages/Sec | 468 |
| Avg. Page Time (sec) | 0.16 |
| Requests/Sec | 448 |
| Requests Failed | 0 |
| Requests Cached Percentage | 0 |
| Avg. Response Time (sec) | 0.15 |
| Avg. Content Length (bytes) | 4.71 |
| Total Tests | 843,249 |
| Failed Tests (% of total) | 0 (0%) |
Great performance in Request/sec (448), Avg. Response Time(0.16s), Total Tests (≈850K) and Failed Test (0).
| Cache usage | ||
|---|---|---|
| Requests not in cache | ≈1606 | 0.19% |
| Requests in cache | 841,643 | 99.81% |
| Total request | 843,249 | 100% |
Cache has no impact on logging.
| Generated logging traces | ||
|---|---|---|
| Action logs | 0 | 0% |
| Cache Action logs | 0 | 0% |
| Total logs | 0 | 0% |
No Information logging traces.
| SQL Statement | Times | Total Execution Time(s) | Average Execution Time (s) | |---------------------------------------------------------------------------------------------------------------------------| | SELECT COUNT(*)... | 1,606 | 0.041983 | 0.002614 | | SELECT TOP(2)... | 1,606 | 0.044243 | 0.002755 | | exec [Authorization].get_user_effective_permissions... | 97 | 0.0.0237 | 0.000244 | | exec [Authorization].get_user_effective_permissions... | 96 | 0.022077 | 0.000230 | | exec [Authorization].get_user_effective_permissions... | 96 | 0.029830 | 0.000352 | | exec [Authorization].get_user_effective_permissions... | 96 | 0.031195 | 0.000325 | | exec [Authorization].get_user_effective_permissions... | 96 | 0.022982 | 0.002394 | | exec [Authorization].get_user_effective_permissions... | 48 | 0.011293 | 0.000235 | | exec [Authorization].get_user_effective_permissions... | 48 | 0.014901 | 0.000310 | | exec [Authorization].get_user_effective_permissions... | 48 | 0.011135 | 0.000232 |
SELECT operations are unnecessary repeated but them are executed fast (≈0.033 ms). Executions of SP are fast, between 0.20 ms and 0.38ms. No insert bulk operations due to cache configuration.
| Top slowest statements | Execution Time(s) |
|---|---|
| exec [Authorization].get_user_effective_permissions... | 0.000740 |
| exec [Authorization].get_user_effective_permissions... | 0.000515 |
| exec [Authorization].get_user_effective_permissions... | 0.000504 |
| exec [Authorization].get_user_effective_permissions... | 0.000497 |
| exec [Authorization].get_user_effective_permissions... | 0.000479 |
Good. Slower statement are executed between 0.48ms and 0.74ms.
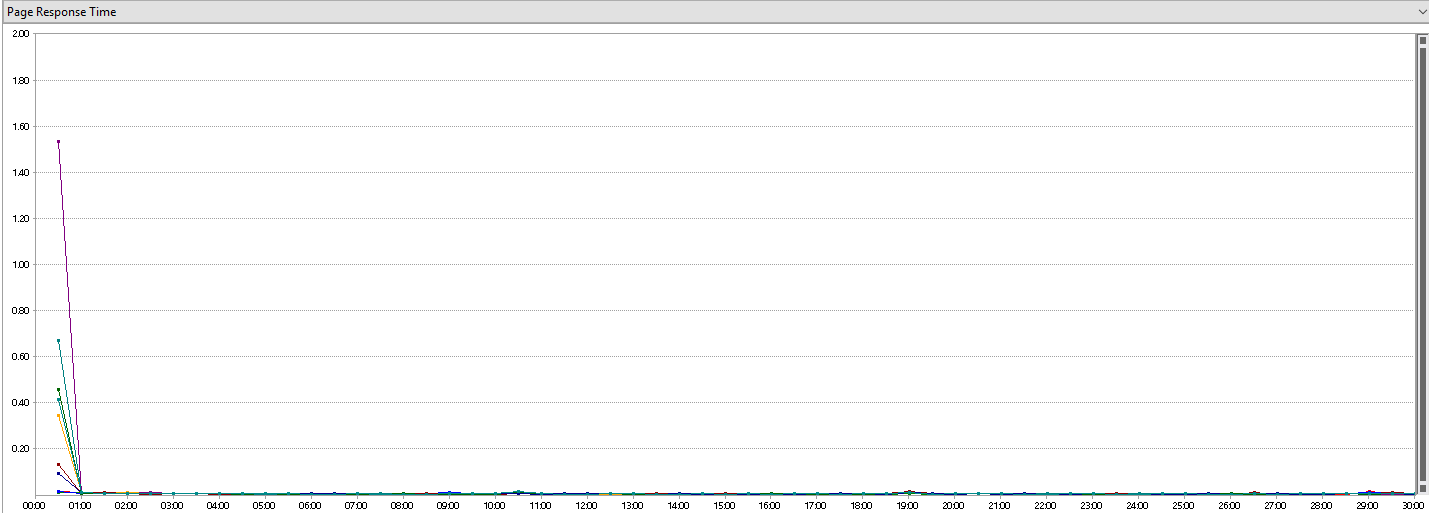
EffectivePermissions (Information)
| Results | |
|---|---|
| Max User Load | 100 |
| Tests/Sec | 9.53 |
| Tests Failed | 0 |
| Avg. Test Time (sec) | 0.012 |
| Transactions/Sec | 0 |
| Avg. Transaction Time (sec) | 0 |
| Pages/Sec | 9.53 |
| Avg. Page Time (sec) | 0.01 |
| Requests/Sec | 9.53 |
| Requests Failed | 0 |
| Requests Cached Percentage | 0 |
| Avg. Response Time (sec) | 0.01 |
| Avg. Content Length (bytes) | 370 |
| Total Tests | 17,154 |
| Failed Tests (% of total) | 0 (0) |
Moderate performance in Request/sec (9.53) and Total Tests (≈17K). Great performance in Avg. Response Time(0.01s).
| Cache usage | ||
|---|---|---|
| Requests not in cache | ≈72 | ≈0.41% |
| Requests in cache | 17,082 | 99.58% |
| Total request | 17,154 | 100% |
High cache usage reduces in a great way the execution of sql statements.
| SQL Statement | Times | Total Execution Time(s) | Average Execution Time (s) | |---------------------------------------------------------------------------------------------------------------------------| | SELECT COUNT(*)... | 72 | 0.002507 | 0.000035 | | SELECT TOP(2)... | 72 | 0.002192 | 0.000030 | | exec [Authorization].get_user_effective_permissions... | 3 | 0.000623 | 0.000208 | | exec [Authorization].get_user_effective_permissions... | 3 | 0.000588 | 0.000294 | | exec [Authorization].get_user_effective_permissions... | 2 | 0.000704 | 0.000352 | | exec [Authorization].get_user_effective_permissions... | 2 | 0.000621 | 0.000311 | | exec [Authorization].get_user_effective_permissions... | 2 | 0.000680 | 0.000340 | | exec [Authorization].get_user_effective_permissions... | 2 | 0.000404 | 0.000202 | | exec [Authorization].get_user_effective_permissions... | 2 | 0.000749 | 0.000375 | | exec [Authorization].get_user_effective_permissions... | 2 | 0.000692 | 0.000346 |
SELECT operations are unnecessary repeated but them are executed fast (≈0.033 ms). Executions of SP are fast, between 0.20 ms and 0.38ms. No insert bulk operations due to cache configuration.
| Top slowest statements | Execution Time(s) |
|---|---|
| exec [Authorization].get_user_effective_permissions... | 0.000421 |
| exec [Authorization].get_user_effective_permissions... | 0.000414 |
| exec [Authorization].get_user_effective_permissions... | 0.000404 |
| exec [Authorization].get_user_effective_permissions... | 0.000346 |
| exec [Authorization].get_user_effective_permissions... | 0.000344 |
Great. Slower statement are executed is less that 0.42ms
Commentaries
This results for EffectivePermissions are inexplicable because the execution path is pretty much similar to HasPermissions endpoint and it should be a slightly minor due to serialization of the response and response size. Many load test with empty logging database, different LoadTest database has been tried with no results.
Improvements
- Cache Multi-tenant DB operations could save unnecessary calls to this DB but saved time will be just a little.
- get_user_effective_permissions SP could be optimized and this way avoid some long execution peaks.